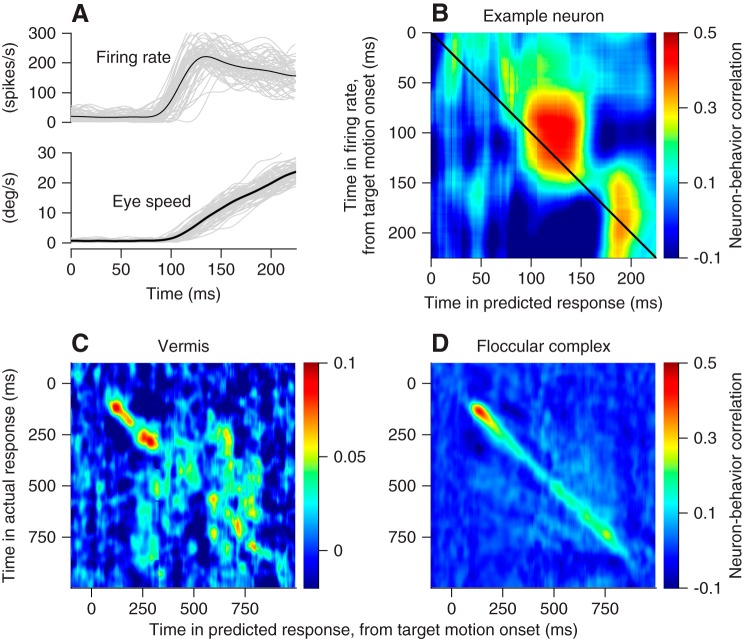
Fig. 9.
Comparison of trial-by-trial neuron-behavior correlations in oculomotor vermis and floccular complex. A: example data from 1 Purkinje cell. Black traces show averages across trials and gray traces show single trials. B–D: each pixel uses color to show the trial-by-trial correlation coefficient between actual firing rate and the firing rate predicted by the regression fit at the times shown on the y- and x-axis. B: data for an example Purkinje cell in the oculomotor vermis. C: averages across all Purkinje cells recorded in the oculomotor vermis. D: averages across all Purkinje cells recorded in the floccular complex.

