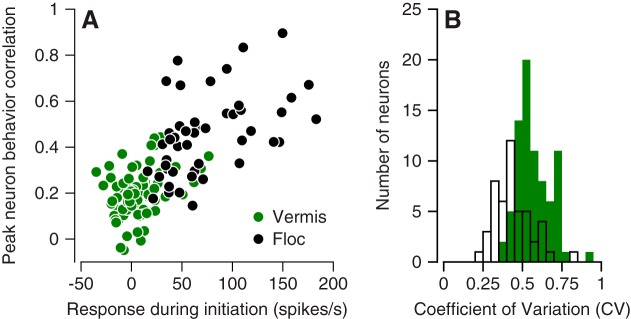
Fig. 10.
Quantitative comparison of neuron-behavior correlations in oculomotor vermis and floccular complex. A: scatterplot showing relationship between the peak neuron-behavior correlation and the peak response during pursuit initiation for all individual Purkinje cells. Green and black symbols show data for vermis and floccular complex. B: distribution of the coefficient of variation of interspike intervals during fixation at straight ahead for both samples of Purkinje cells: Green and white bars show data for vermis and floccular complex.

