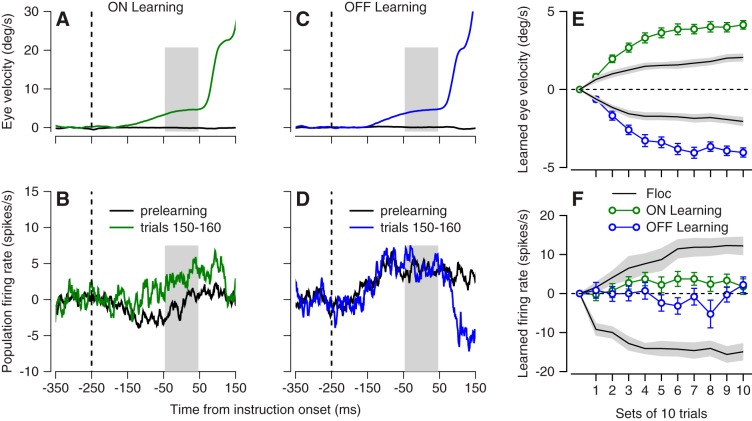
Fig. 12.
Very small learned changes in simple-spike firing during direction learning in the oculomotor vermis. A and B: learned eye velocity (A) and change in simple-spike firing rate (C) for on-direction learning blocks in an example Purkinje cell. C and D: learned eye velocity (C) and change in simple-spike firing rate (D) for on-direction learning blocks in an example Purkinje cell. E: learning curves for eye velocity. F: learning curves for simple-spike firing rate. In E and F, green and blue symbols show averages across all experiments for on-direction and off-direction learning in the oculomotor vermis, and black traces summarize data from the floccular complex. Gray ribbons indicate means ± SE across floccular Purkinje cells.

