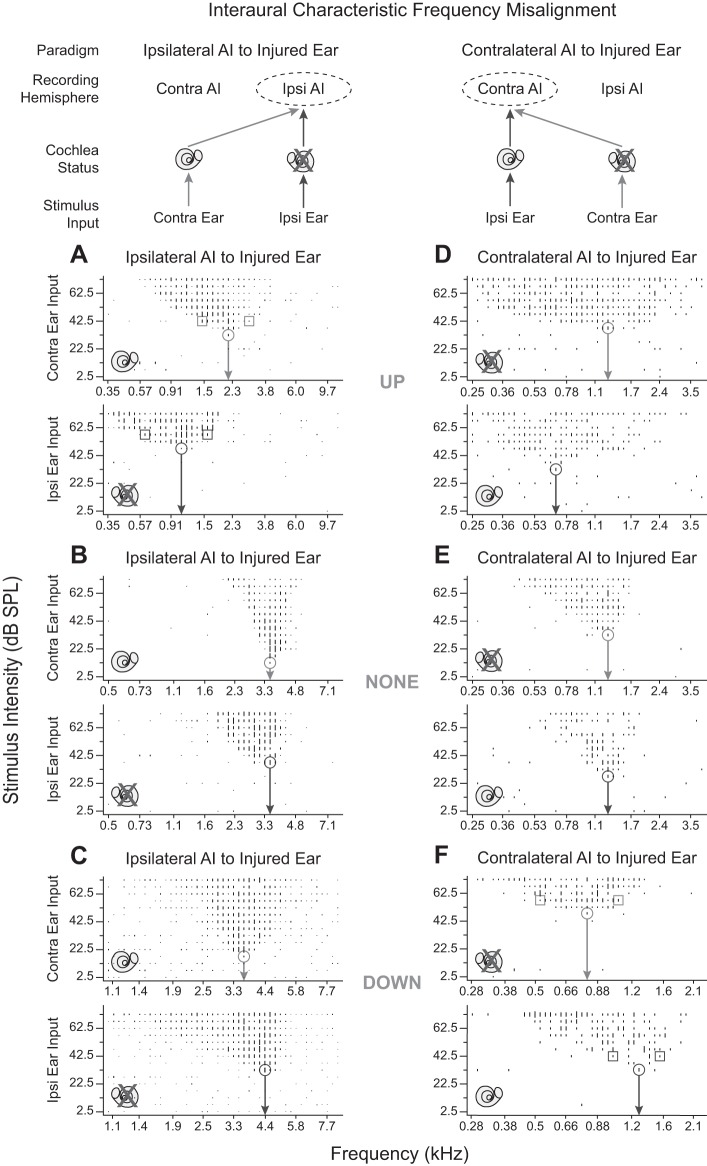
Fig. 2.
Frequency tuning curves (FTC) from the 2 ears illustrate 3 classes (UP, NONE, and DOWN) of interaural characteristic frequency (CF, arrow) misalignment in primary auditory cortex (AI) ipsilateral and contralateral to the injured right ear (X crossout). Top: summary of cochlea status of contralateral (contra) and ipsilateral (ipsi) ear inputs to each AI. A–F, top subplot: FTC from contra ear input. Bottom subplot: FTC from ipsi ear input. Bottom subplot CF is the reference value for CF misalignment classification. A–C and D–F show data from AI ipsi and AI contra to the injured ear, respectively. A and F illustrate nonoverlap of tuning curve bandwidth 10 dB above threshold (BW10) with CF derived from the other ear. Input ear is specified at bottom left of subplots. Circle marks CF; square marks upper and lower frequency edges of BW10.

