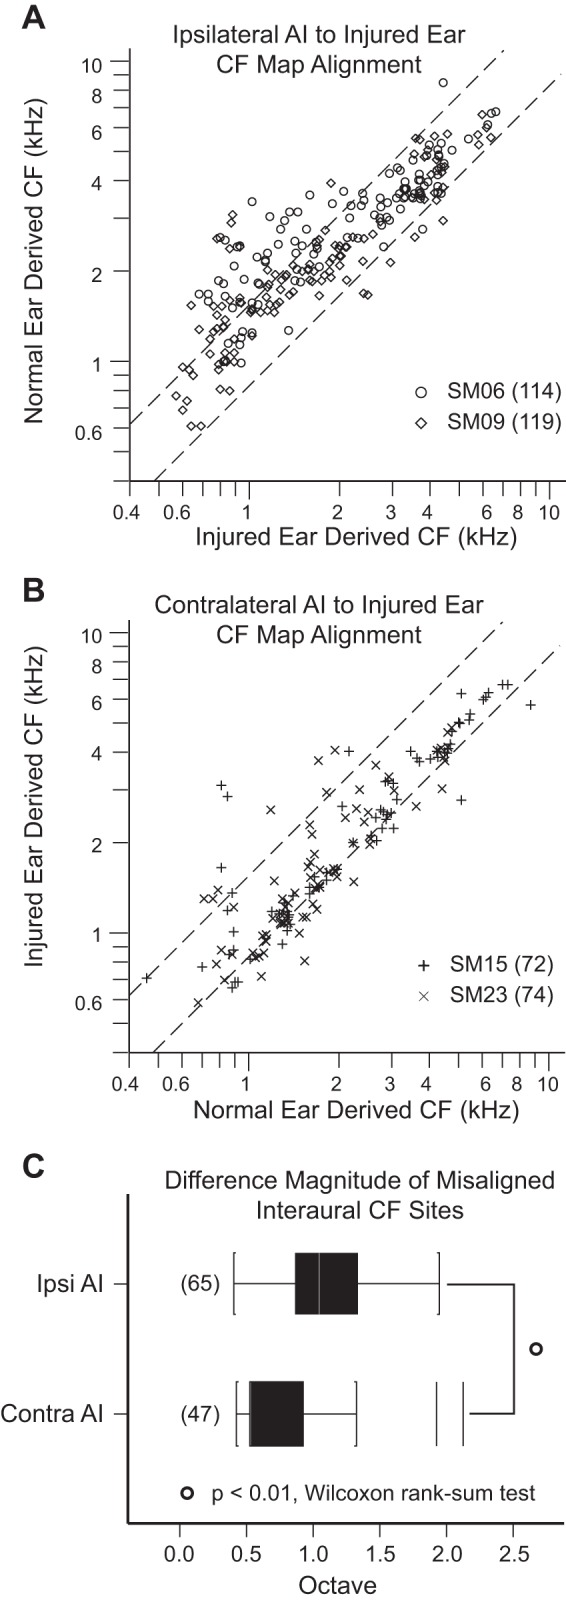
Fig. 3.

Interaural characteristic frequency (CF) alignment. Right is the injured ear. A and B: scatterplots of CF derived from normal ear vs. injured ear input obtained in AI ipsilateral and AI contralateral to the injured, right ear. Data were collected 24 wk after acoustic overstimulation. Dashed lines represent the 95% confidence interval of CF alignment in normal animals (Cheung et al. 2009). Data in ipsilateral AI (A) and contralateral AI (B) fall above and below limits of the 95% confidence interval (upper bound: 0.63 octaves; lower bound; −0.27 octaves), indicating cortical misalignment of the frequency input from the 2 ears. C: ipsilateral AI absolute CF difference magnitude for sites above and below the 95% confidence interval is nearly twice the CF difference in contralateral AI (P < 0.01, Wilcoxon rank sum test). CFs from the ear contralateral to the recorded hemisphere are plotted on x-axis. Counts of cortical recording sites are in parentheses. Ipsilateral AI refers to AI ipsilateral to the injured ear. Contralateral AI refers to AI contralateral to the injured ear.
