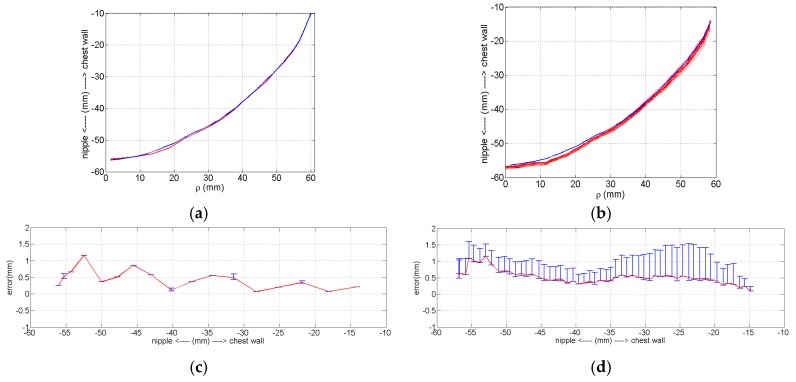
Figure 5.
Comparing accuracy and precision between static and dynamic measurements of model B. (a) Reference profile (blue) and three set of static measurements (red). (b) Reference profile (blue) and 15 sets of dynamic measurements (red). (c) Mean static measurement error and max/min error bars. (d) Mean dynamic measurement error and max/min error bars.

