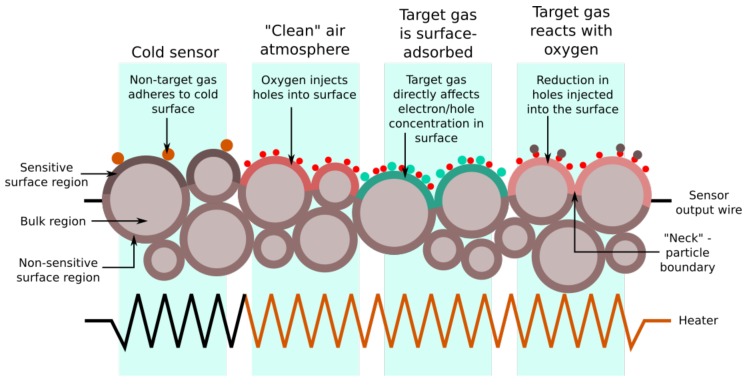
Figure 1.
Diagram of the various types of interaction between atmospheric gases and an MOS sensor surface. In the leftmost region, the sensor is unpowered (and exhibits the base resistance). The three other regions of the diagram describe different processes that actually occur simultaneously to varying degrees. The sensor’s output is the resistance across the whole of the sensor material, which forms a resistor network with contributions from both the bulk and surface regions (although the non-sensitive surface will have similar properties to the bulk). This model of the sensor material also explains the wide variation in base resistance between individual sensors of the same type, as the random nature of the surface geometry means an equally random network of resistances. This diagram is a two-dimensional representation of a three-dimensional material; in an actual sensor, the sensitive region is spread into the surface with a distance dependent on the grain size and arrangement resulting from the sintering.

