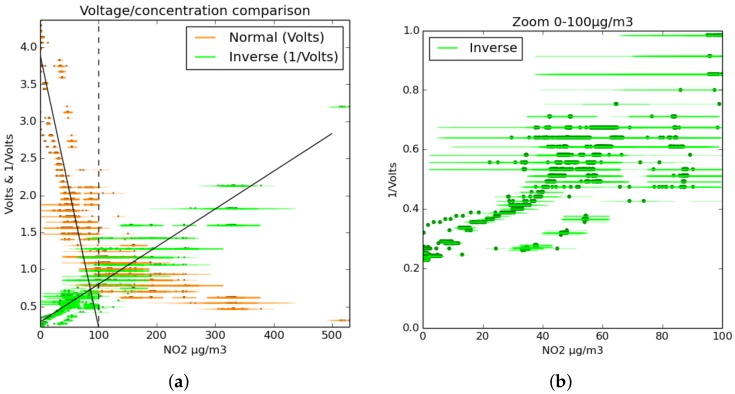
Figure 7.
Results from the BBCEAS calibration experiment, showing both the raw output voltage and inverse voltage of the same measurement. The darker points are the data; the horizontal lines are the error ranges of the concentration. The experiment demonstrated sensitivity up to 400 as shown in (a). Although at high concentrations, the voltages from the sensors becomes quite low, in most atmospheres, NO2 does not often surpass 50 ppb. For concentrations less than 100 , both normal and inverse voltage can be seen as approximately linear. Graph (b) shows the data for inverse voltage at low concentrations.

