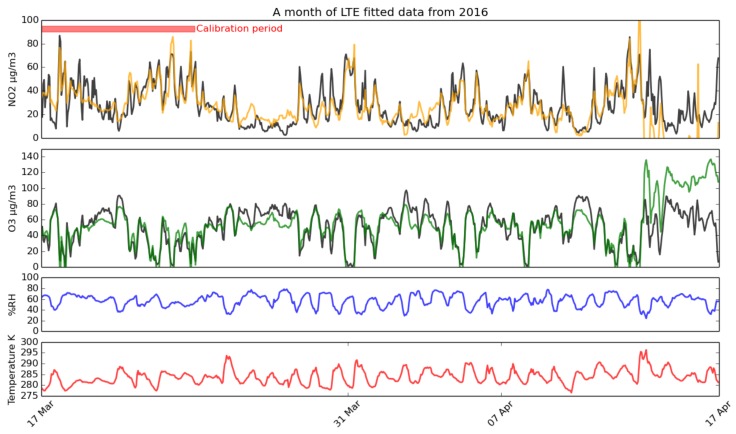
Figure 9.
A typical month-long time series from the long-term experiment, with concentrations produced by fitting the sensor output using Equations (13) and (17) for NO2 (orange) and O3 (green) respectively to the AURN station data (black), over the calibration period highlighted in red. Temperature and humidity are also included, showing a clear diurnal cycle.

