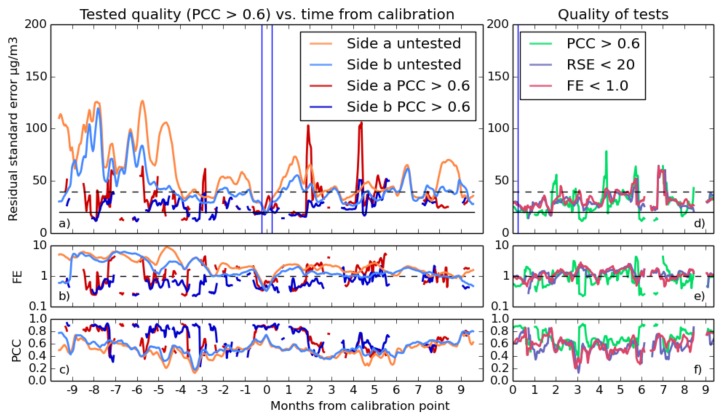
Figure 12.
(a–c) Comparison between sensor data for NO2 without goodness testing (light) and with (dark). Both Sensors a and b are plotted. Since fewer fits are used, error due to averaging is higher, and there are both gaps and alarming spikes in the RSE in graph (a). However, testing for fractional error improves both FE and correlation. (d–f) shows the effect using various tests has on the statistics of the data, averaging the absolute time from calibration and over both sensors.

