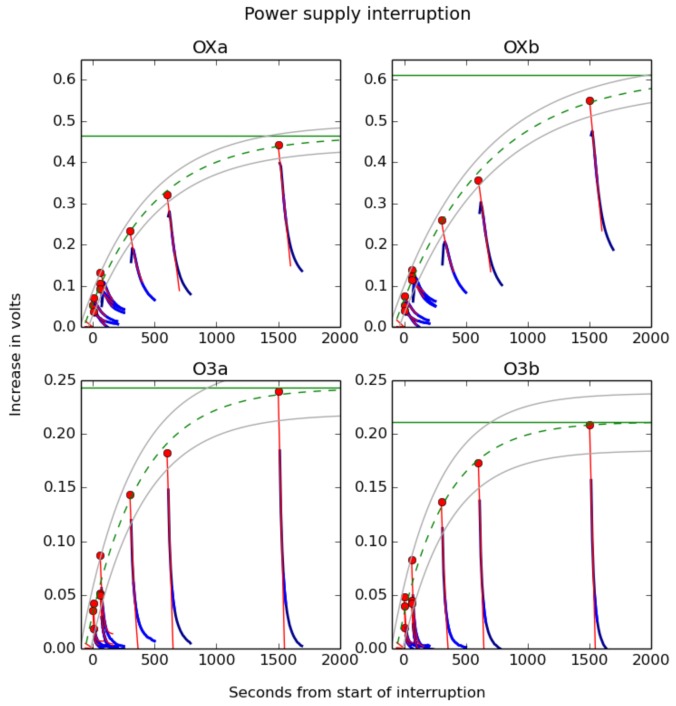
Figure 15.
Fitted curves after power supply interruption for four different sensors, two each of oxidising (OXa and OXb) and ozone (O3a and O3b), mounted in the same enclosure. The blue curves are the time-shifted raw voltage curves; the red lines are hysteresis-compensated voltage curves with points at the time at which the power supply was reconnected; the dashed green line is an exponential curve fitted to these points showing the likely voltage curve when the power is disconnected and the sensor is cooling; and the solid green line is the unpowered baseline voltage inferred from this fit. The grey curves above and below the exponential fit are the 95% confidence interval for it.

