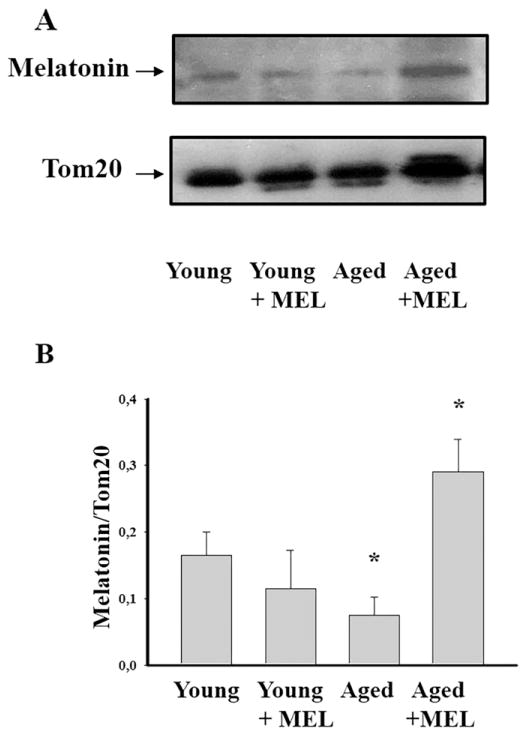
Fig. 3.
Level of MEL in RLM isolated from each experimental groups. A - Western blot of mitochondrial suspension obtained after isolated RLM as ascribed Section 2. Membranes were stained for the presence of MEL by anti-MEL related receptor antibody. Protein concentration was 30 μg per lane. B - Quantitation of immunostaining using computer-assisted densitometry. Bar graphs representing MEL immunoreactivity in RLM isolated from each experimental rat groups. Protein bands were quantified after normalization with respect to Tom20. The bar graphs in B show mean ± SD from three independent experiments. *P < 0.05, significant difference for samples isolated from young MEL-treated, aged, aged MEL-treated rats in comparison with those from young rats.

