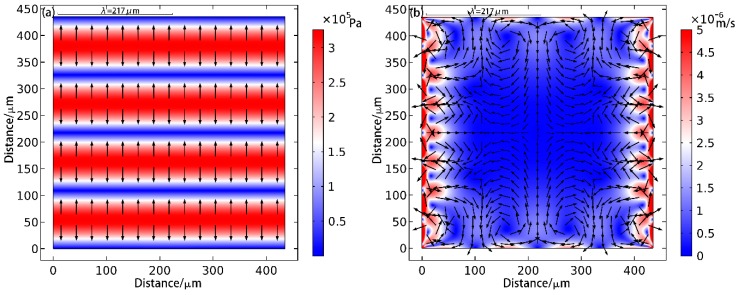
Figure 2.
Simulation of one-dimensional particle patterning. In the figure (a), the background color represents the amplitude of the sound pressure, with blue for the node, red for the antinode, and the arrow indicating the direction of the sound radiation force. The figure (b) is the simulation result of microstreaming in the cavity, and the arrows represent the direction of the liquid flow and the background color represent the velocity of the microstreaming.

