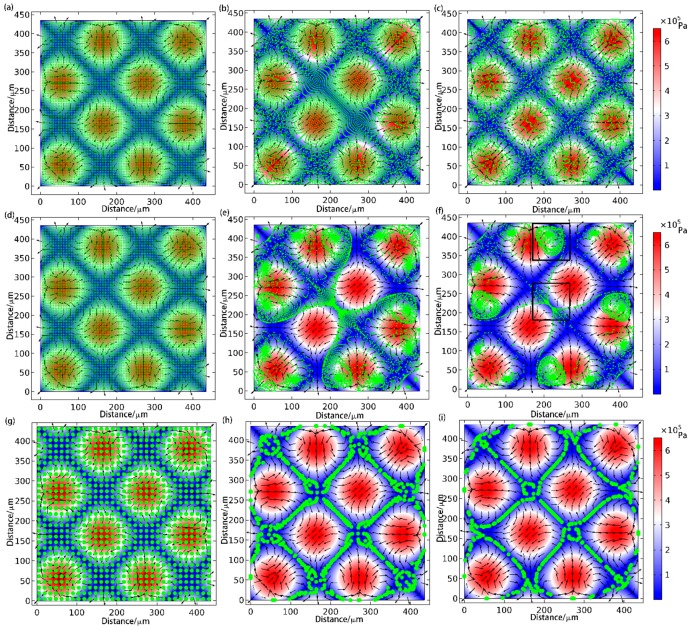
Figure 5.
Simulation results in the continuous time with the arrows representing the flow velocity of the microfluidics, the color of the background the magnitude of the sound pressure in the standing wave field, and the green particles the polystyrene microspheres. (a–i) are the pattern of particles whose diameters are 1, 3, and 10 μm aggregation on different times. (To provide better visual effects, the 1 μm particles are zoomed in three times).

