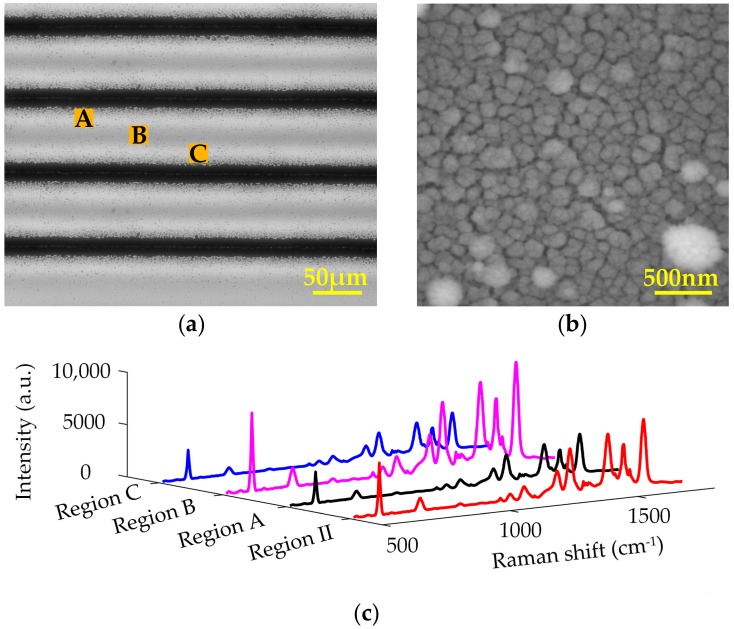
Figure 3.
(a) Microscope image of the microgroove array created on Si surface by multi-line laser ablation; (b) SEM image of the region marked with B in (a); (c) SERS signals of R6G in the regions marked with A, B, and C in (a) in comparison with those in Region II of the single-line ablated Si substrate.

