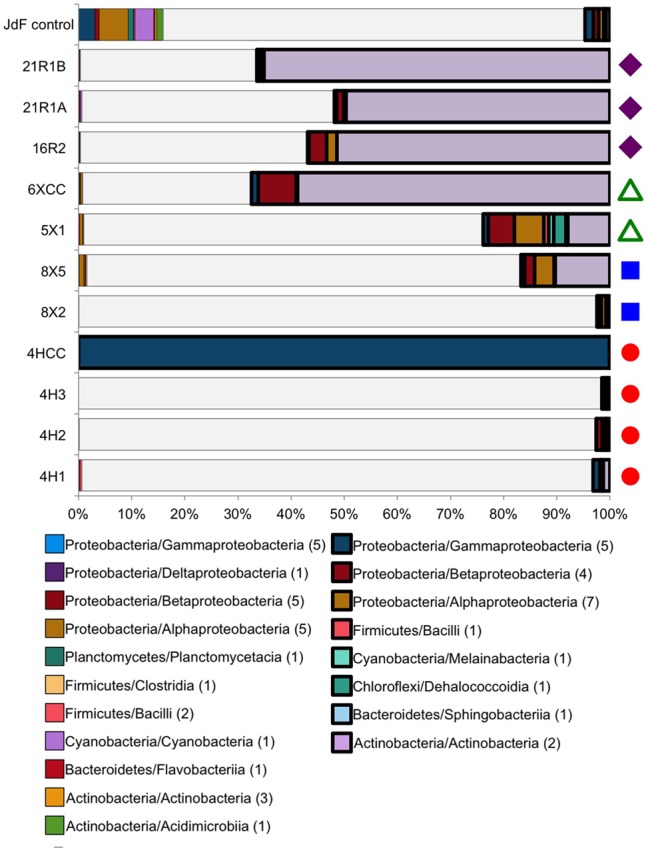
FIGURE 3.

Taxonomic distribution at the class level of the Bacteria tag sequences found in both the JdF control sample (a plastic bag used to deliver the fluorescent microsphere solution in a core catcher during basalt coring) and the sediment and basalt samples. Taxonomic groups that are present in both the control and samples, and highly abundant in the sediment/basalt samples (i.e., 10X more sequences than in JdF control, 10X sample), are represented in bold on the right side. Taxonomic groups that are in relatively the same abundance in both the sediment/basalt samples and in the JdF control are on the left side (control:sample). The sequences that were unique to samples are represented in white, indicating the fraction of sequences that were kept for comparison analyses (samples only). Number in parentheses in legend indicates how many OTUs are in each class. Colored symbols on right-hand side in B indicating sample location the same as in Figure 1.
