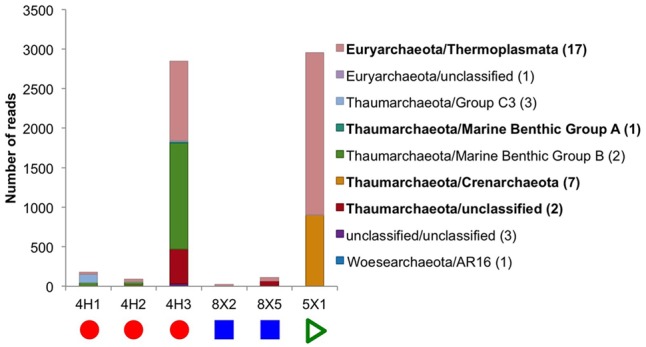
FIGURE 4.

Taxonomic distribution at the class level of the Archaea tag sequences found in the sediment samples. No archaeal 16S rRNA genes could be sequenced from subseafloor basalt samples or the control. In bold are the classes that were found in higher abundance and are discussed in the main text. Number in parentheses in legend indicates how many OTUs are in each class. Due to the low number of reads in some samples, the graph is displayed as actual reads instead of being normalized to 100%. Colored symbols on at bottom indicating sample location the same as in Figure 1.
