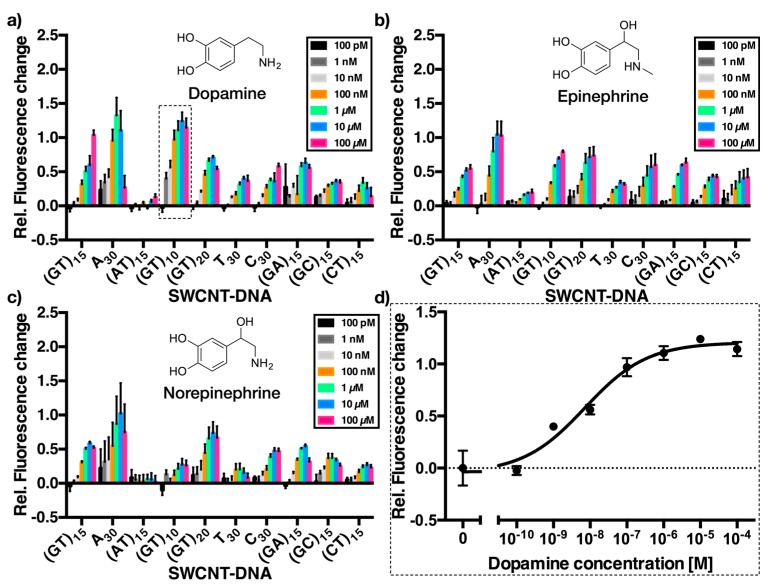
Figure 3.
Dose-response curves of different catecholamine SWCNT/DNA sensors. Relative fluorescence change of the sensors upon addition of increasing concentrations (0, 100 pM, 1 nM, 10 nM, 100 nM, 1 μM, 10 μM, 100 μM) of dopamine (a), epinephrine (b), and norepinephrine (c). The x-axis shows different DNA sequences used to functionalize the SWCNTs. Here, the (6,5)-SWCNTs responses were evaluated. Errors are standard deviations (n = 3). (d) An example dose-response plot for dopamine recognition of SWCNT-(GT)10. Errors are standard deviations (n = 3).

