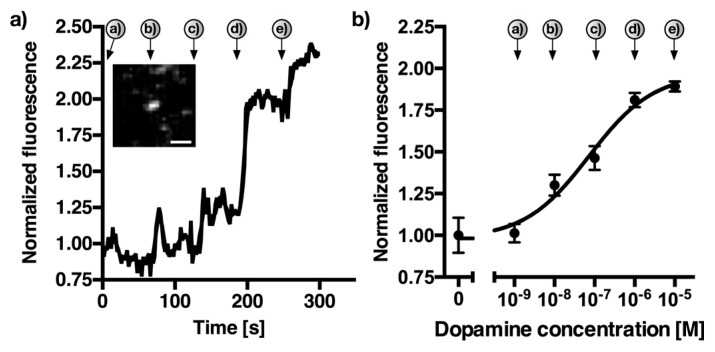
Figure 6.
Dynamic detection of dopamine in the presence of norepinephrine. NIR fluorescence image of a single (SWCNT)-DNA sensor. Here, 1 nM to 10 μM dopamine was added approx. each 60 s (a = 1 nM, b = 10 nM, c = 100 nM, d = 1 μM, e = 10 μM) in the presence of 50 nM norepinephrine in phosphate-buffered saline. (a) Example SWCNT-(GT)10-trace showing a change in fluorescence intensity upon dopamine addition. Inset shows the NIR-fluorescence image of the single sensor at t = 300 s. Fluorescence counts were normalized. Scale bar = 1 μm. (b) Dose-response curve generated from the mean fluorescence changes of eleven different SWCNT-(GT)10 sensors between each addition-point of dopamine. Errors are standard deviations (n = 11).

