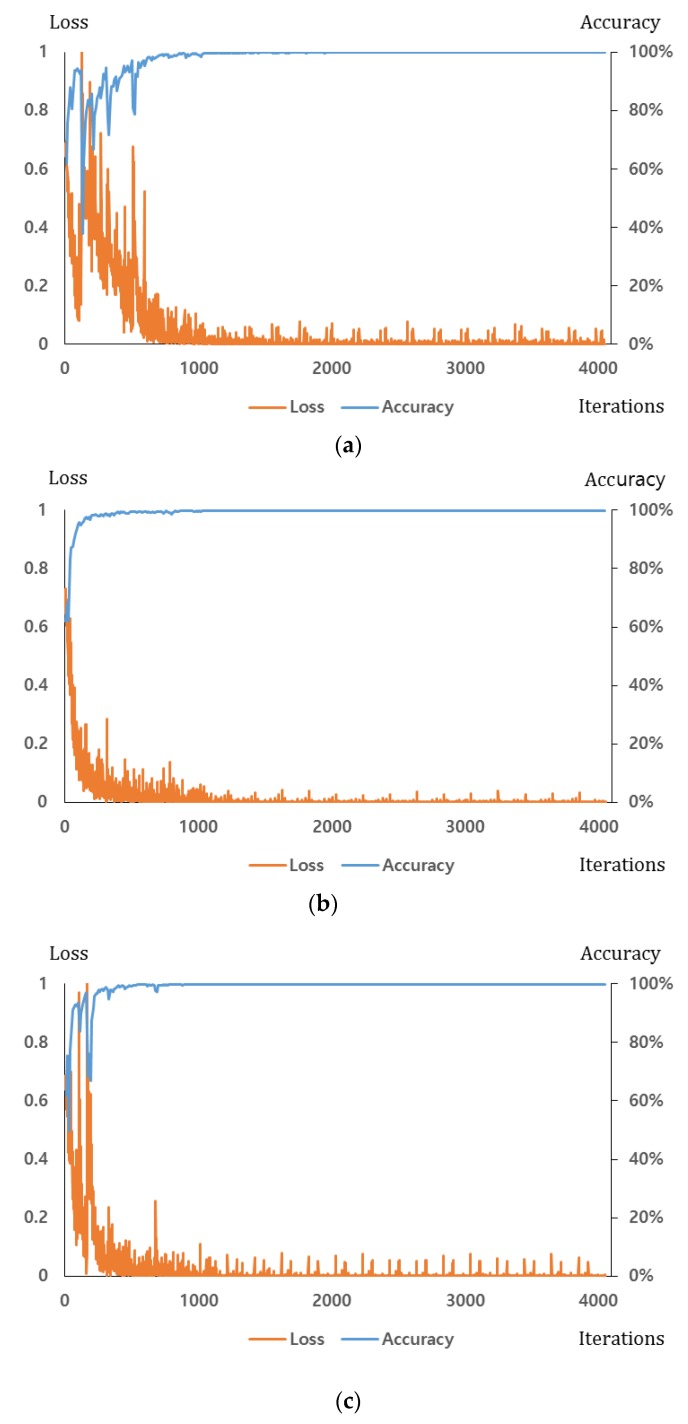
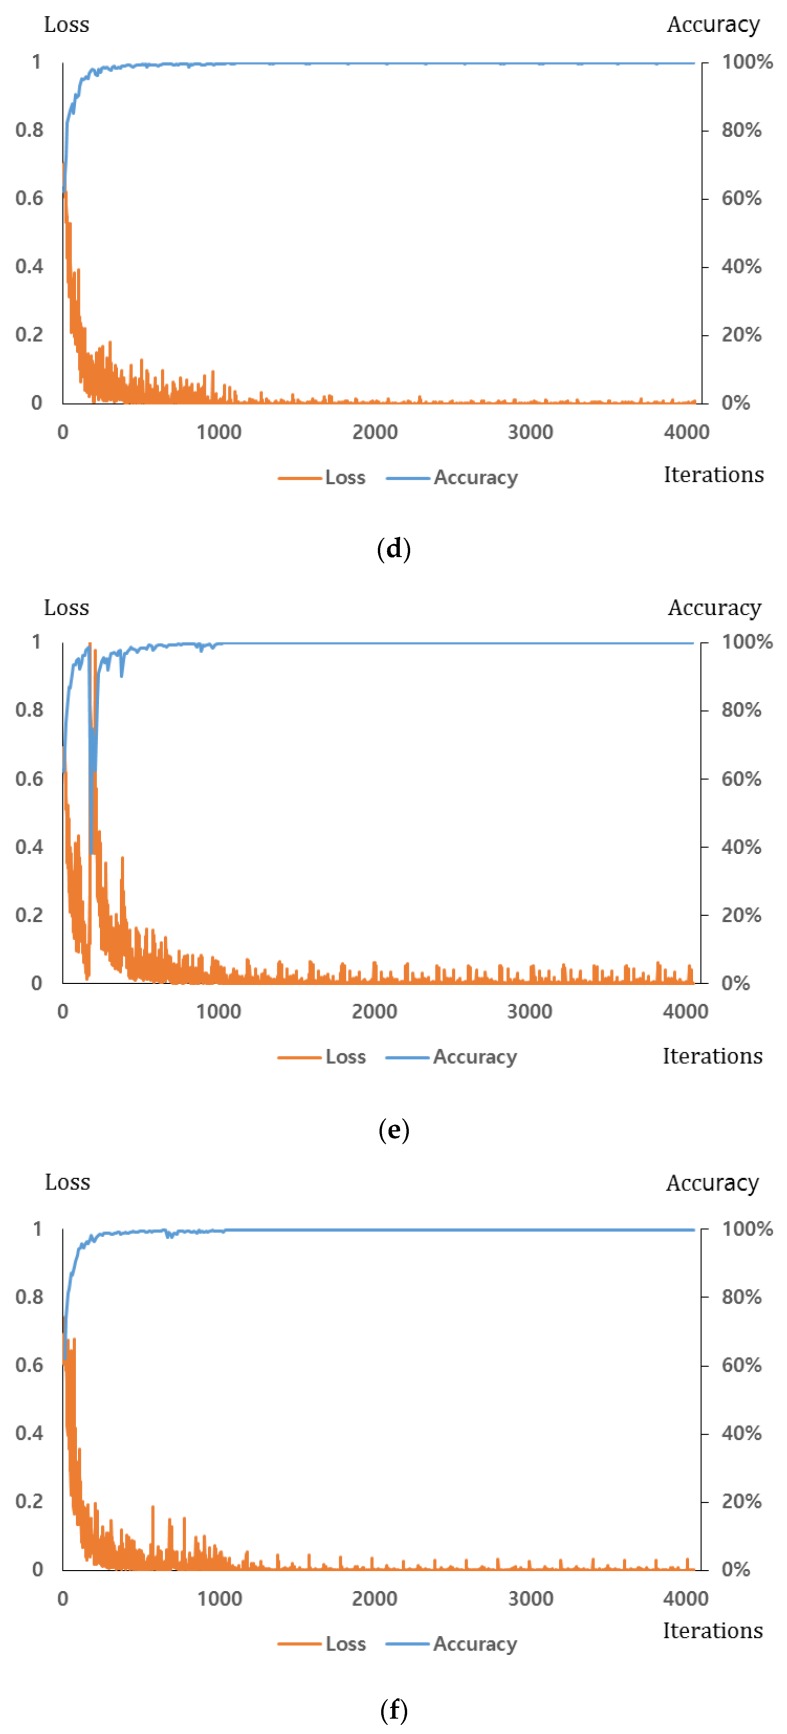
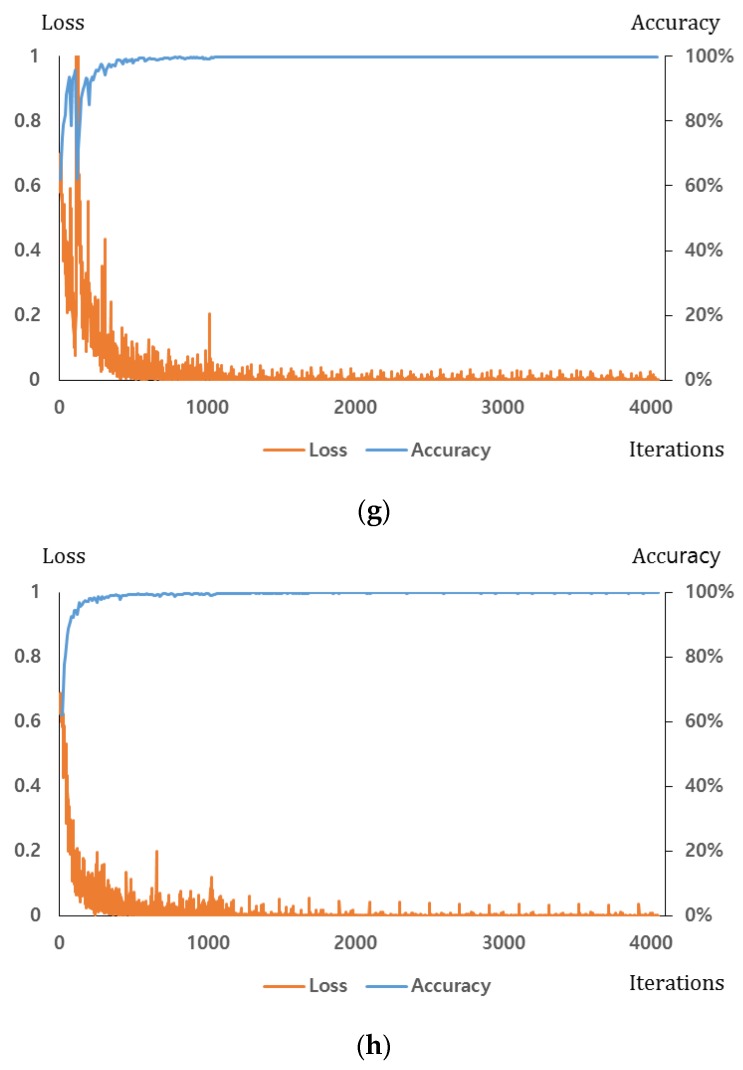
Figure 9.
Loss and accuracy graphs of the training procedure: (a) the 1st fold (visible light candidate images); (b) the 1st fold (FIR candidate image); (c) the 2nd fold (visible light candidate images); (d) the 2nd fold (FIR candidate image); (e) the 3rd fold (visible light candidate images); (f) the 3rd fold (FIR candidate image); (g) the 4th fold (visible light candidate images); (h) the 4th fold (FIR candidate image).


