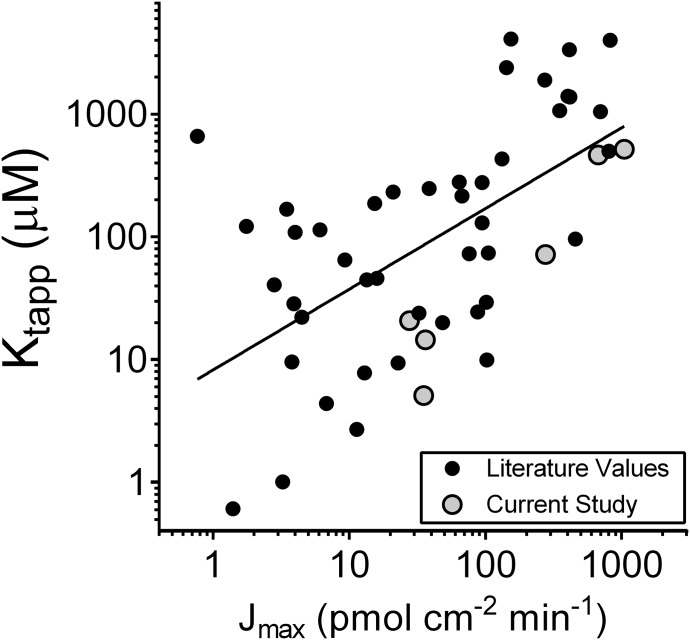
Fig. 6.
Relationship between Jmax and apparent Kt values for OCT2-mediated transport of 23 distinct substrates. Solid black circles show values reported in the literature (see Supplemental Table 1 for a list of these values and the corresponding references). Shaded gray circles show the values for the six substrates used in the present study. The line is simple linear regression of these data (Prism).

