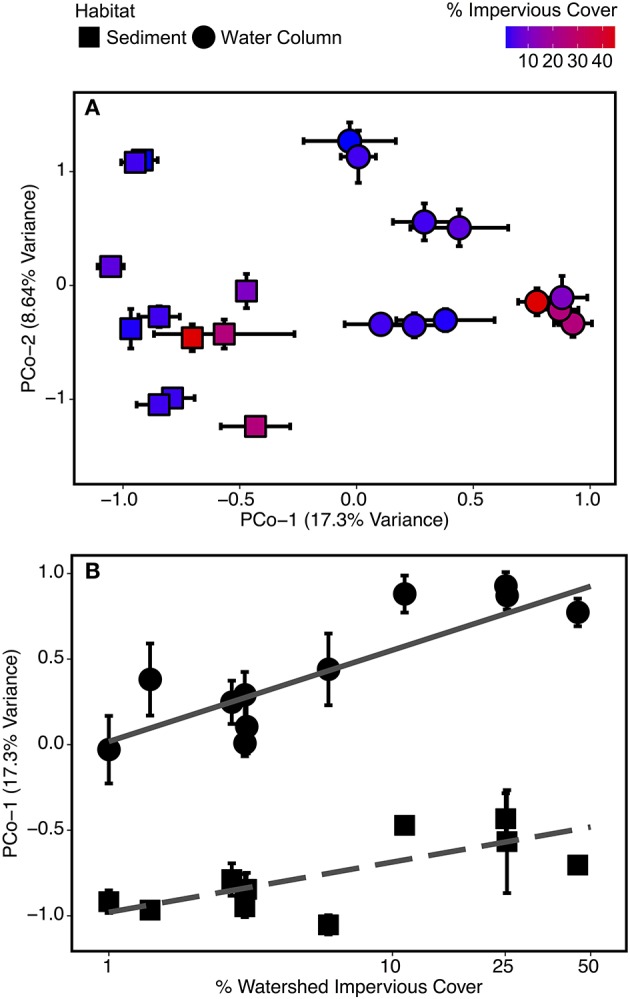
Figure 4.

Biplot of (A) the first two PCoA scores of microbial OTU Bray-Curtis distances plotted by site and habitat type (sediment and water column) and (B) percent watershed impervious cover at a site vs. principal coordinate axis 1 (PCo-1) scores. Each point is identified according to site land cover type (forested and urbanized) and sample habitat (sediment and water column). Error bars represent standard error from repeated measurements taken February 2012-February 2013. OTUs with highest total loadings for principal coordinate (PCo) dimensions 1 and 2 are identified in Table 2.
