Figure 6.
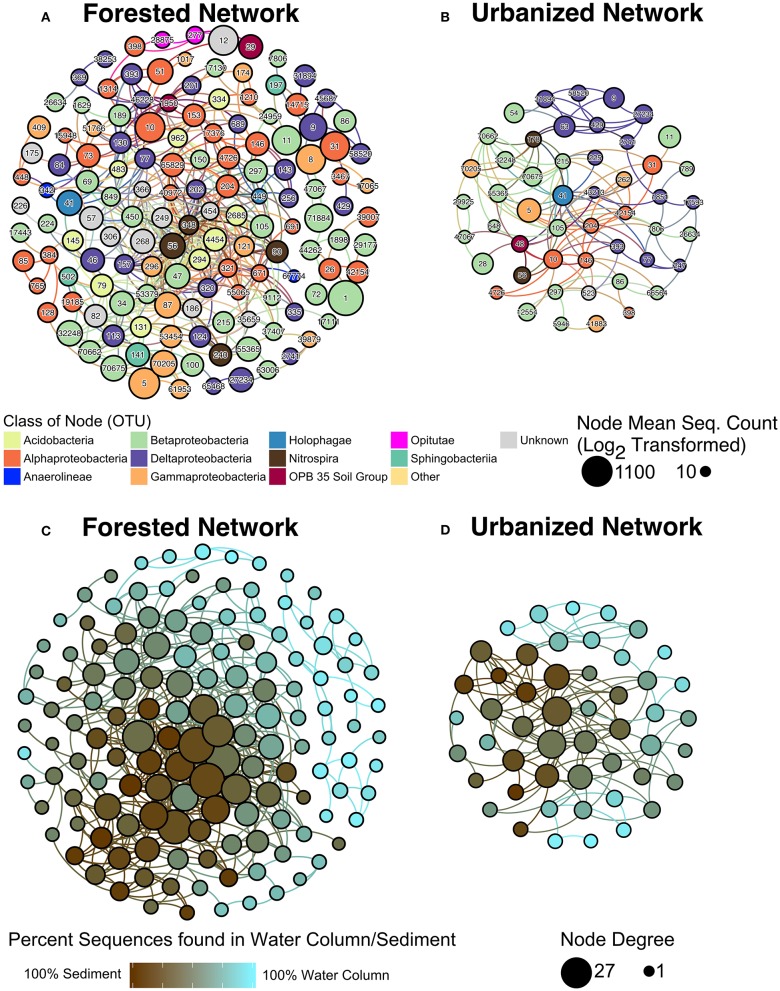
Microbial co-occurrence networks from (A) forested, (B) urbanized watersheds. Each node is color coded according to its taxonomic class and the size of the node represents the Log2 of the mean number of sequences across all samples linked to the OTU identified. The (C) forested and (D) urbanized networks were replotted with node color indicating the proportion of sequences linked to water column vs. sediment samples for that OTU and node size indicates degree, which is the number of vertices that connect to that node. The taxonomic identity and network statistics for each OTU ID indicated in panels (A,B) is included in Supplementary Table 1.

