Figure 7.

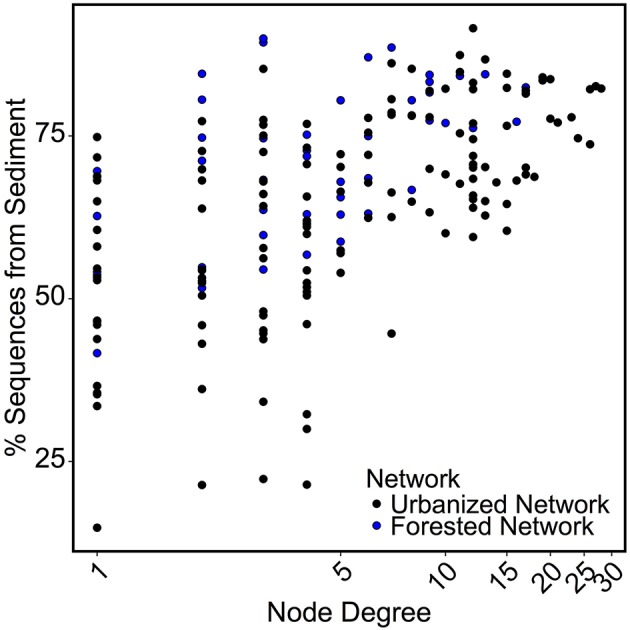
Scatterplot comparing node degree to the percent of sequences found in sediment samples for the OTU represented by that node. A significant positive correlation (p < 0.01) was found across both networks.

Scatterplot comparing node degree to the percent of sequences found in sediment samples for the OTU represented by that node. A significant positive correlation (p < 0.01) was found across both networks.