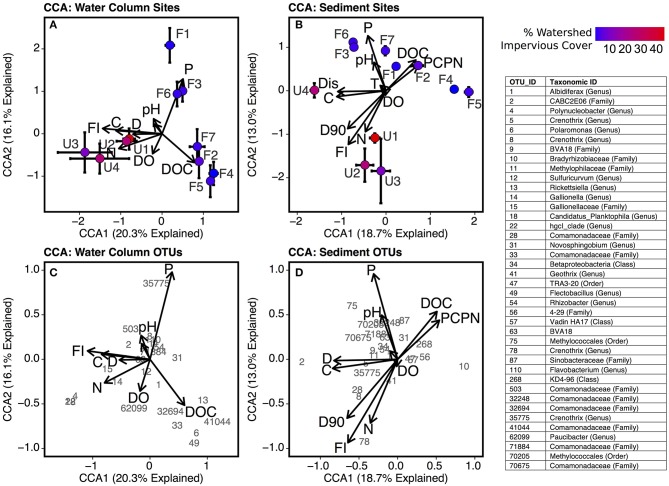
Figure 8.
Biplots of canonical correspondence analysis (CCA) scores for environmental factors (indicated by arrows) and scores for each site using (A) water column samples and (B) sediment samples. Sites are plotted according to mean CCA scores with error bars representing standard error of the mean across replicate samples. Biplots with environmental factors and top OTUs (identified by number) in (C) water column samples and (D) sediment samples are also included. Factors are abbreviated as follows: Sediment C:N (PCPN), orthophosphate (P), sediment D90 (d90), conductivity (C), discharge (D), dissolved organic carbon concentration (DOC), fluorescence index (FI), temperature (T), and total dissolved nitrogen (TDN). For clarity purposes, the factor loading arrow for C:N of suspended particulates is unlabeled in panels (A,C).

