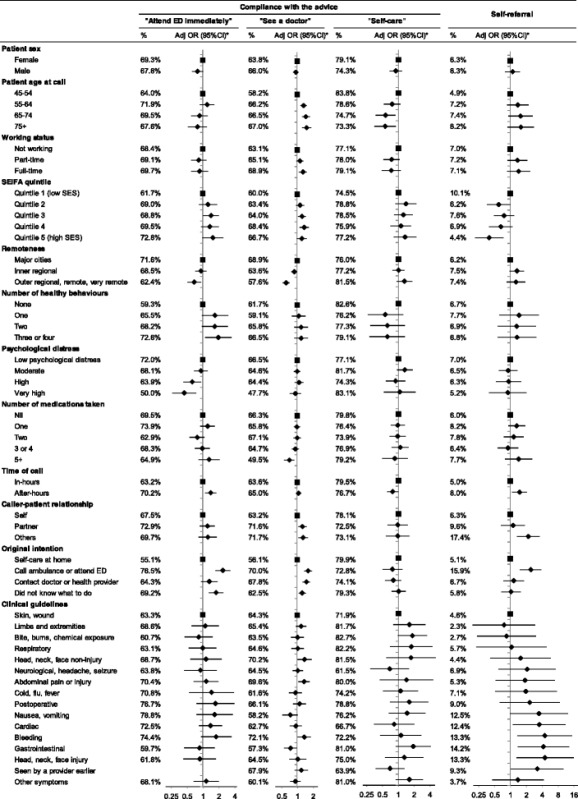
Table 4.
Compliance and self-referral according to patient and call characteristics, % and adjusted odds ratio (95%CI)

Adjusted for patient age at call, sex, country of birth, marital status, people can depend on, education, household income, working status, private health insurance, SEIFA, healthy behaviours, BMI, general health, medication taken, time of call, caller-patient relationship, original intention, and triage protocols. Models examining remoteness did not include SEIFA, models examining morbidity did not include number of medications taken. See Additional file 1: Table S3 for further details. Forest plots: The diamond shapes represent adjusted odds ratios, the horizontal bars represent the 95%CIs, the square shapes represent reference categories.
