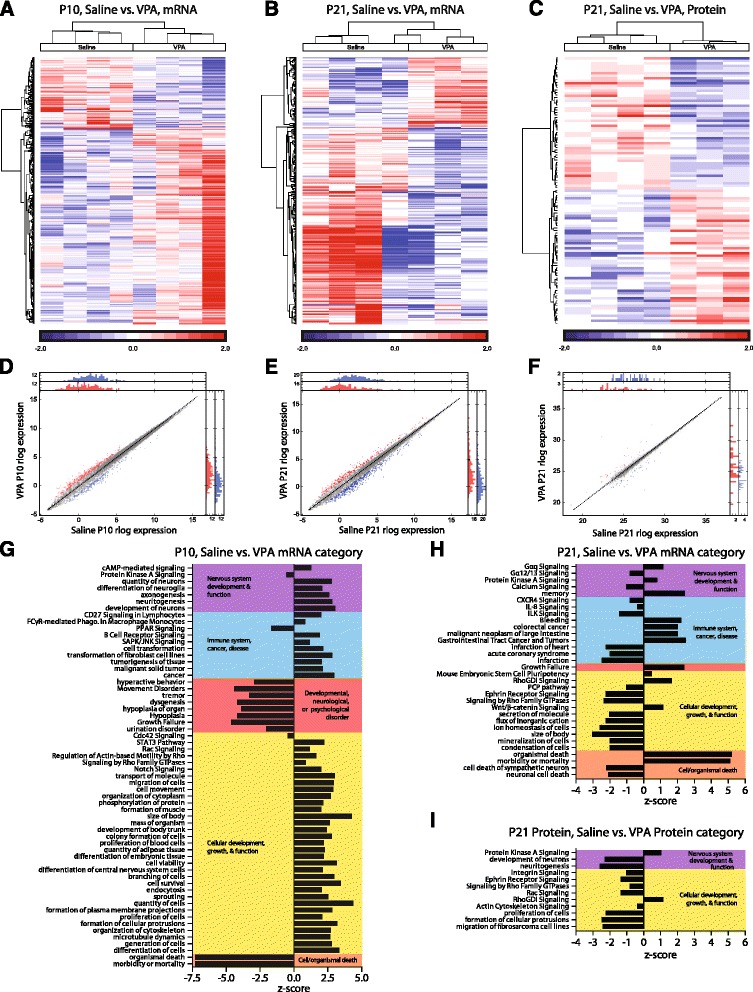
Fig. 3.

Early enhancement but later deficit in cellular growth and neural development in amygdala from prenatal VPA-exposed animals. Heat maps of differential gene expression between saline and VPA at P10 (a), P21 (b), and of differential protein expression at P21 (c) depict log2 fold changes of genes with p < 0.05. Differential expression scatterplots and transcript histograms of individual genes at P10 (d), P21 (e), and of individual proteins at P21 (f), where red and blue points represent molecules with over 2-fold up- or down-regulation changes, respectively, in log expression across time. Treatment effects did not reach statistical significance after FDR multiple comparison correction, thus Ingenuity Pathway Analyses were run on genes with uncorrected p < 0.05 treatment effects at P10 (n = 542) and P21 (n = 406). Pathways with predicted activation changes between saline and VPA transcriptomic samples at P10 (g) and P21 (h) and protein samples at P21 (i)
