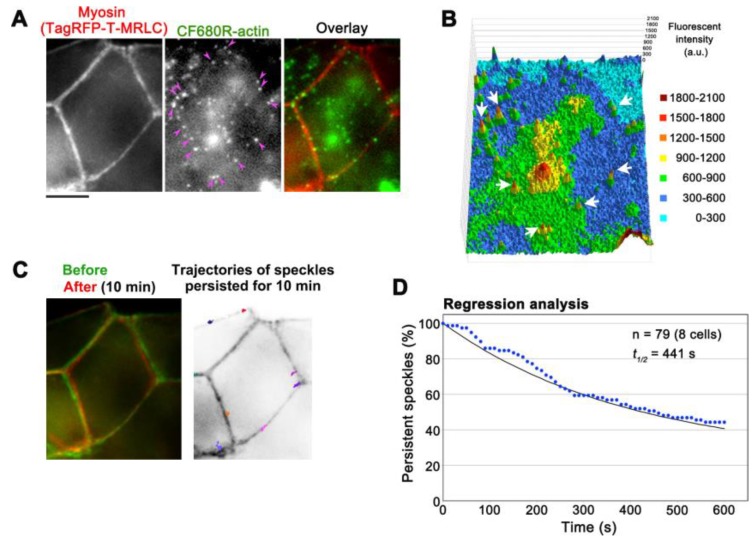
Figure 5.
Observation of CF680R-actin SiMS in actomyosin bundles associated with adherens junctions (AJs) in A6 cells. (A) Representative images of actomyosin bundles visualized by TagRFP-T-myosin regulatory light chain (MRLC, left), CF680R-actin SiMS (middle), and the merged image (right). Pink arrowheads indicate CF680R-actin SiMS in actomyosin bundles associated with AJs. Bar = 5 µm; (B) The middle image of (A) is shown in a 3D profile, in which the z-axis represents the fluorescence intensity of CF680R-actin. The fluorescence intensity of each pixel is shown with colors as indicated. White arrows indicate CF680R-actin SiMS; (C) Left: A merged image of actomyosin bundles associated with AJs visualized by TagRFP-T-MRLC before (green) and after (red) a 10 min time-lapse imaging of CF680R-SiMS. Right: Trajectories of CF680R-actin SiMS in actomyosin bundles associated with AJs. The trajectories of actin SiMS that persisted from the first image to the last image of a 10 min time-lapse imaging were indicated with colored lines and overlaid with the inverted image TagRFP-T-MRLC (before); (D) Speckle regression analysis of CF680R-actin SiMS in actomyosin bundles associated with AJs in eight cells. The black line indicates that the one-phase exponential curve fitted to the data (blue dots) gives 441 s for the half-life of SiMS.

