Figure 6.

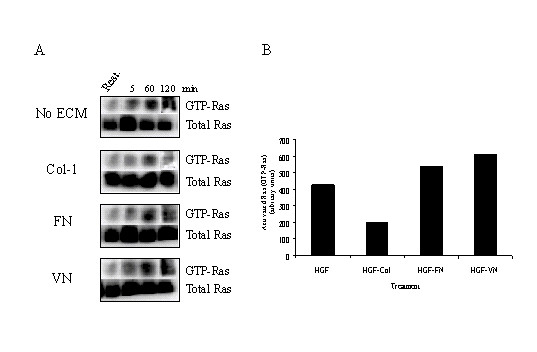
Enhanced and sustained activation of Ras by HGF-FN and HGF-VN Complexes Panel A-Kinetic GTP-Ras pull down analysis. HMVEC suspensions (3 × 10⁶/ml) were stimulated with HGF (10 ng/ml) in the absence and presence of ECM molecules (2 μg/ml) as shown for 5, 60 and 120 min at room temperature. Lane Rest. represents resting (unstimulated) levels of GTP-Ras. Cells were pelleted and lysed in cold MLB buffer (see methods). Samples of cell free lysates were incubated with of RBD-Sepharose and then analysed by SDS-PAGE and Western blotting probing for Ras. Visualization was by chemilumininescence using a Kodak imaging station. Panel B-The levels of GTP-Ras at the 60 min time point from the gel shown in panel A were quantified by densitometric analysis using ImageQuant software (Kodak).
