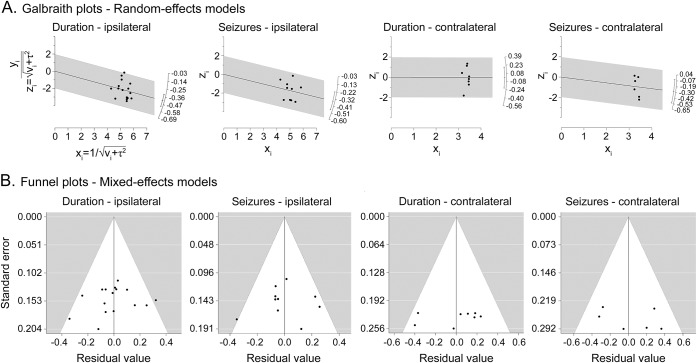
Figure 3. Galbraith (radial) plots for random effects models and funnel plots for mixed-effect models.
(A) Galbraith (radial) plots for random effects models and (B) funnel plots for mixed-effect models. For mixed-effects models, study moderator is represented by volumetry technique (automated vs manual).

