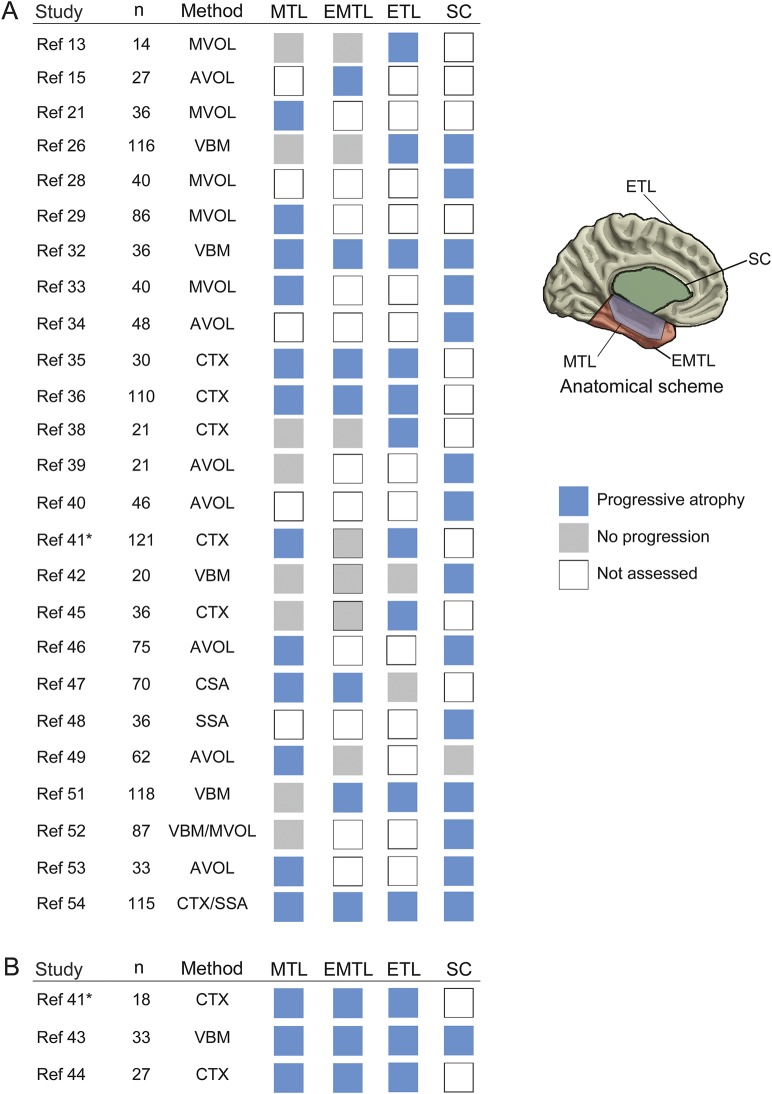
Figure 4. Systematic review on whole brain studies addressing progressive atrophy.
Studies are divided into (A) cross-sectional and (B) longitudinal analyses. For each study, the sample size and quantitative MRI methods are provided as well as the reported finding (blue: progressive atrophy, gray: no progression, white: progression not assessed) across 4 brain subsystems (mesial temporal lobe [MTL], extramesial or lateral temporal lobe [EMTL], extratemporal cortical areas [ETL], subcortical gray matter [SC]). * Progressive mesio-temporal atrophy further documented at a subregional level in a subsequent analysis,e11 based on a largely overlapping cohort. For further information, see table e-1. AVOL = automated volumetry; CTX = cortical thickness analysis; MVOL = manual volumetry; SSA = surface-based shape analysis; VBM = voxel-based morphometry. McDonald 2008A and 2008B, Alhusaini 2012A and 2012B, and Keller 2015A and B refer to references 38, 39, 46, 47, 52, and 54, respectively.

