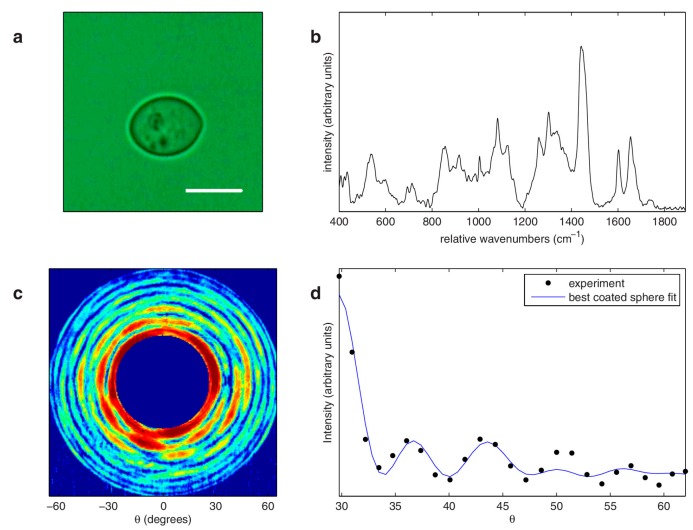
Figure 2.
IRAM measurements of Saccharomyces cerevisiae. (a) Bright field image of the measured yeast cell. Scale bar indicates 5 μm. (b) Raman spectrum from the yeast cell shown in (a). (c) Elastic scattering pattern from the yeast cell (color scale runs from blue (low) to red (high)). (d) Azimuthally averaged data from (c) (black dots) and associated best fit using a coated sphere model (solid blue line), with extracted core and coat diameters of 6.06 and 6.22 μm, respectively. Reprinted from Smith et al., [94], with the permission from AIP Publishing.

