Fig. 4.

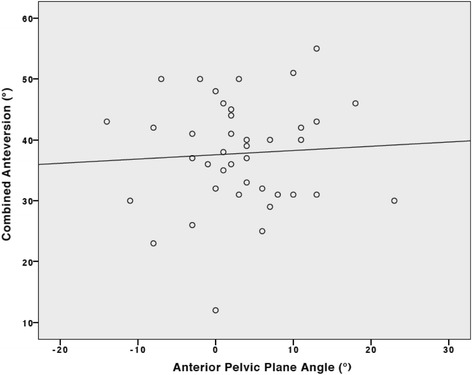
Scatter plot between combined anteversion values measured with the cup-liner system and anterior pelvic plane values. Linear regression: y = 37.55 + 0.07 * x (R2 = 0.004, P = 0.71)

Scatter plot between combined anteversion values measured with the cup-liner system and anterior pelvic plane values. Linear regression: y = 37.55 + 0.07 * x (R2 = 0.004, P = 0.71)