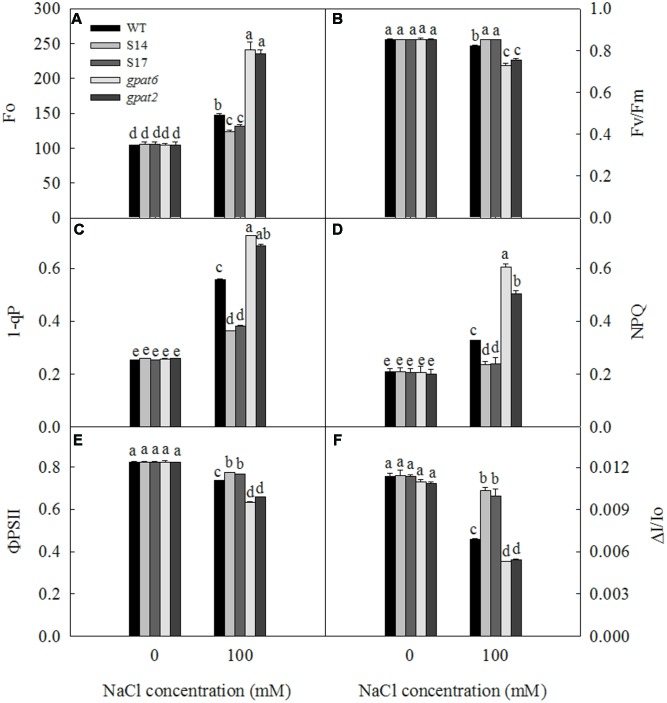
FIGURE 7.
Effect of NaCl treatment on Fo (A), Fv/Fm (B), 1-qP (C), NPQ (D), ΦPSII (E), and ΔI/Io (F) of WT, transgenic Arabidopsis plants and T-DNA mutant Arabidopsis strains. Data are presented as the means of six replicates ±SD (n = 6). For each column, different letters a, b, c, and d indicate a significant difference at P ≤ 0.05.

