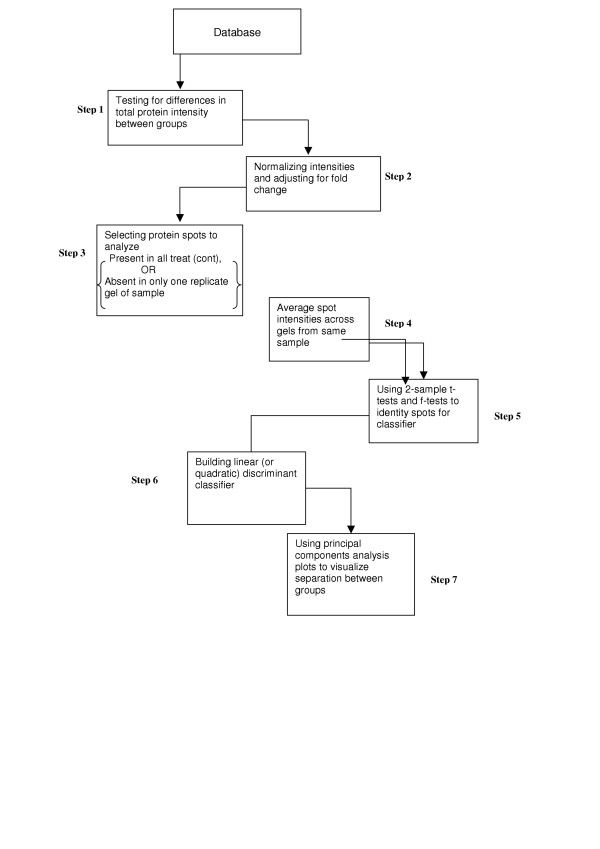
Figure 2.

Statistical protocol for 2D gels. The second protocol that we followed in the statistical analysis of data from 2D gel experiments is demonstrated in the flowchart in Figure 2. This consists of: 1) testing for differences between the groups with respect to total protein expression; 2) normalizing protein intensities on a gel to the mean total intensity of its group (e.g. treatment or control); expressing each normalized intensity as a fraction of the total protein intensity in the experiment in order to make fold change comparisons meaningful; 3) selecting the subset of protein spots to analyse; 4) Average spot intensities across gels from the same sample; 5) imputing values for missing spot intensities; 6) using 2-sample t-tests and f-tests to identify protein spots that can be used to build classifiers; 7) building a linear (or quadratic) discriminant classifier; and 8) using Principal Components Analysis plots to demonstrate the separation between groups visually.
