
Figure 3. Chromosomes in micronuclei are susceptible to extensive and catastrophic shattering in mitosis.
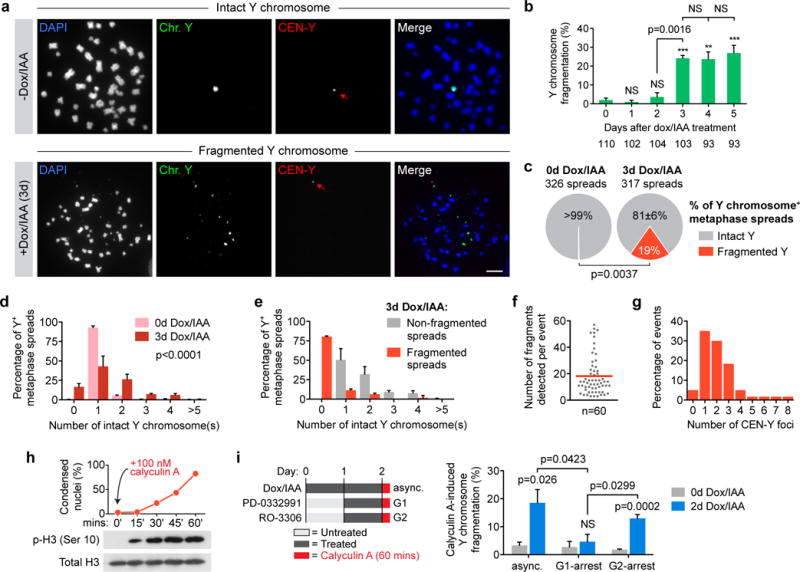
(a) Representative FISH images of metaphase spreads prepared from 0d or 3d CENP-AC-H3-rescued cells co-hybridized to Y chromosome paint probes (green) and Y centromere probes (red). Lower example shown contains ~18 detectable Y fragments and one centromere signal (red arrow). Scale bar, 10 μm. (b) Quantification of fragmentation frequency over the indicated time intervals. Data represent the mean ± SEM of n = 3 independent experiments, and the total number of metaphase spreads analysed across the 3 experiments are indicated below the bars. (c) Metaphase spreads collected from 0d or 3d CENP-AC-H3-rescued cells were analyzed for Y fragmentation as in a–b and represent the mean of n = 3 independent experiments. Data from d–g are compiled from spreads collected in c. (d) Distribution of intact Y chromosome copy number by FISH analysis. Data represent the mean ± SEM of n = 3 independent experiments (317–326 spreads pooled from 3 experiments) and P-value indicates significance by two-way ANOVA. (e) Distribution of intact Y chromosome copy number derived from fragmentation-negative or -positive metaphase spreads following 3d CENP-AC-H3 rescue and FISH analysis. Data represent the mean ± SEM of n = 3 independent experiments (255 non-fragmented spreads and 62 fragmented spreads total). (f) The number of detectable Y fragments produced per fragmentation event was quantified and the red line indicates the mean of 60 events. (g) Distribution of the number of Y centromere signals produced per fragmentation event (60 events scored). (h) Addition of calyculin A to asynchronous cells induces rapid chromosome condensation (top) and histone H3 phosphorylation (bottom). DAPI-stained DLD-1 cells were examined for condensation and metaphase-like appearance from >135 nuclei per time point. (i) Calyculin A was used to induce premature chromosome condensation (as indicated on the left) followed by spread preparation and processing for FISH as in (a). Data represent the mean ± SEM of n = 4 independent experiments (162–276 spreads per condition). Asterisks and p-values for b–c and i indicate significance by two-tailed Student’s t-test compared to untreated control cells or as denoted. ***P<0.001, **P<0.01, NS = not significant. Source data for b, c, d, e, h, and i are provided in Supplementary Table 1.