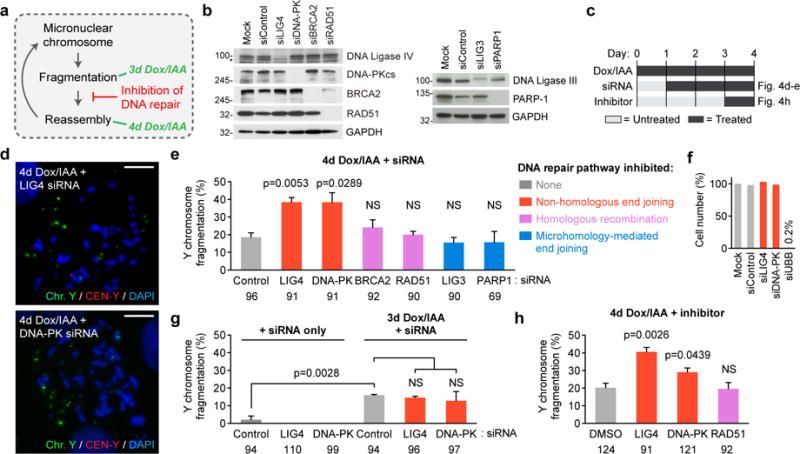
Figure 4. Shattered chromosomal fragments are re-ligated by canonical non-homologous end joining.

(a) Schematic depicting hypothesis of turnover between fragmentation and reassembly. (b) Depletion of target protein as confirmed by immunoblotting 3d post-siRNA transfection in DLD-1 cells. Asterisk indicates a non-specific band from the anti-LIG4 antibody. Blots are representative of 2 independent experiments, and unprocessed scans are shown in Supplementary Fig. 6. (c) Experimental schematic used for the indicated panels. Detailed timeline for each experiment is provided in Supplementary Fig. 4f. (d) Representative metaphase FISH images of Y chromosome fragmentation events derived from 4d CENP-AC-H3-rescued cells 3d post-transfection with the indicated siRNAs. Scale bar, 10 μm. (e) Quantification of d. Data represent the mean ± SEM of n = 3 independent experiments, and the number of total metaphase spreads analysed are shown below the graph. (f) DLD-1 cell numbers were counted 3d post-transfection with the indicated siRNAs and normalized to mock-transfected cells. Data represent the mean of biological triplicates. (g) Quantification of metaphase spreads with Y chromosome fragmentation with or without 3d CENP-AC-H3 rescue following 3d siRNA transfection. Data represent the mean ± SEM of n = 3 independent experiments, and the number of total metaphase spreads analyzed are indicated. (h) Quantification of Y chromosome fragmentation from 4d CENP-AC-H3-rescued cells treated with chemical DNA repair inhibitors as indicated in (c). Data represent the mean ± SEM of n = 3 independent experiments (LIG4, RAD51) or n = 4 independent experiments (DMSO, DNA-PK), and the number of total metaphase spreads analyzed are indicated. Significance for e and g–h are determined by two-tailed Student’s t-test compared to control siRNAs or DMSO conditions or as denoted. NS = not significant. Source data for e, f, and h are provided in Supplementary Table 1.
