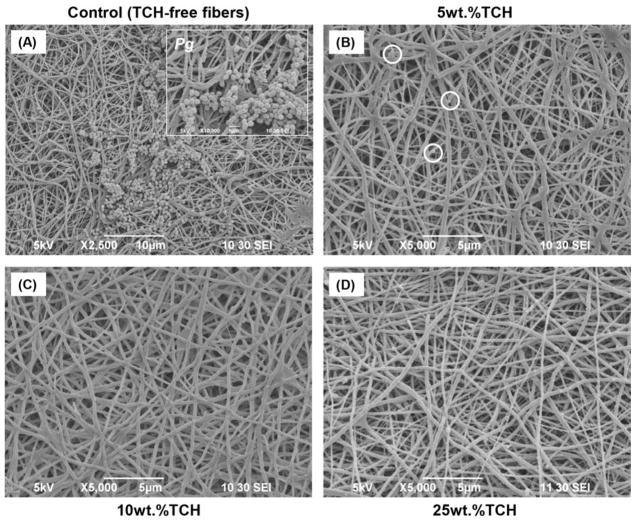
Fig. 3.
Representative SEM images of the electrospun fibers following Pg exposure. (A) control PLA:PCL/GEL [TCH-free], (B) PLA:PCL/GEL+5wt.%TCH, (C) PLA:PCL/GEL+10wt.%TCH, and (D) PLA:PCL/GEL+25wt.%TCH. (A) Note the presence of Pg biofilm covering most of the nanofibrous surface. Inset SEM image (10,000× magnification, scale bar = 1 μm) demonstrates the morphological aspects of Pg. (B) SEM image indicates (white circles) the presence of Pg bacteria only in a few areas on the 5 wt.% of TCH-containing fibers. (C–D) SEM images revealing complete absence of Pg on the fibers containing TCH at 10 and 25 wt.%.

