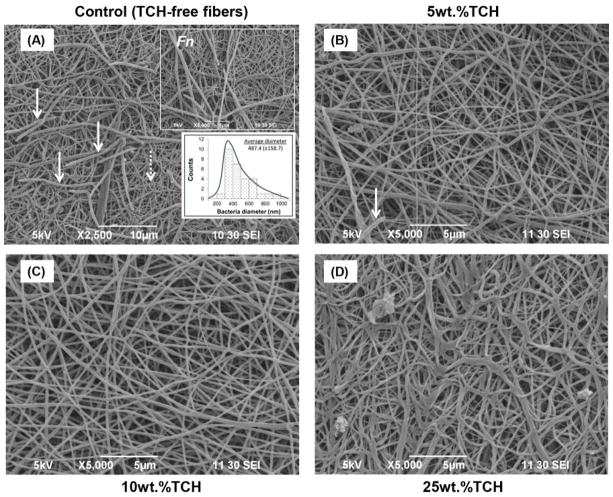
Fig. 4.
Representative SEM images of the electrospun fibers following Fn exposure. (A) control PLA:PCL/GEL [TCH-free], (B) PLA:PCL/GEL+5wt.%TCH, (C) PLA:PCL/GEL+10wt.%TCH, and (D) PLA:PCL/GEL+25wt.%TCH. (A) Note the presence of Fn biofilm (solid white arrows) covering most of the nanofibrous (dotted white arrow) surface. Upper inset SEM image (5,000× magnification, scale bar = 5 μm) indicates the morphological aspects of Fn. Lower inset graph demonstrates the mean bacterial diameter. (B) SEM image demonstrates (white arrow) the presence of Fn bacteria only in a few areas on the 5 wt.% of TCH-containing fibers. (C–D) SEM images revealing complete absence of Fn on the fibers.

