Figure 3.
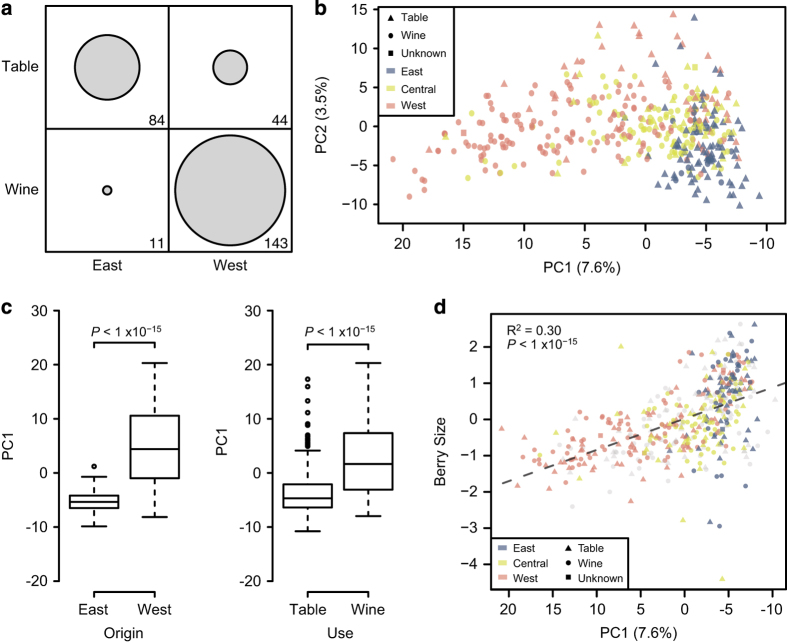
Genetic structure based on use, geographic origin, berry size and berry color. Principal component analysis (PCA) was performed using genome-wide SNP data. The percentage of the variance explained by each PC is indicated in parentheses along each axis. (a) In all, 282 accessions had information for both geographic origin and use. Circled areas are proportional to the number of observations within each category. Plot was created using the R package tableplot.66 (b) Accessions are labeled according to use with point shape (table, wine or unknown) as well as geographic origin in Europe based on point color (East, Central or West). PCs were determined using all accessions, but only those with geographic information are shown. (c) Boxplot of PC1 values for East and West as well as wine and table grapes. Results are reported from a Mann–Whitney U-test. (d) Correlation (r2) between PC1 and berry size. Accessions are labeled according to use (point shape) and geography (point color). Accessions without use or geography information are colored in gray. R2 and P-value are reported from a Pearson correlation test. The PC1 axis is shown in reverse order to be consistent with geography (that is, East to the right and West to the left).

