Figure 1.

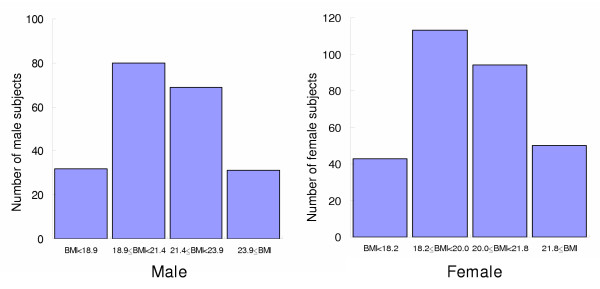
BMI distribution of Chinese university students. The BMI of male and female students was categorized into 4 groups according to mean BMI ± 1 standard deviation (SD).

BMI distribution of Chinese university students. The BMI of male and female students was categorized into 4 groups according to mean BMI ± 1 standard deviation (SD).