
Figure 1.
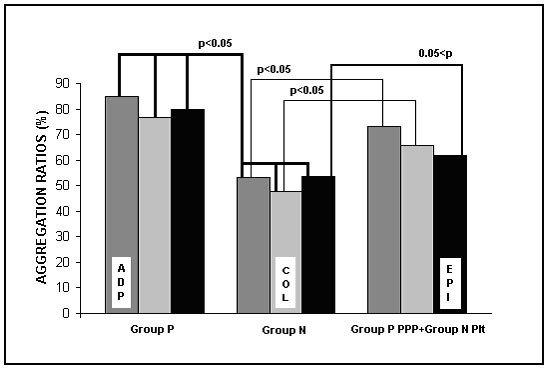
Induced platelet aggregation ratios in Groups P and N. Group P: Patients with mitral stenosis, Group N: Control subjects, PPP: Platelet-poor plasma, Plt: platelet, ADP: Adenosine diphosphate, COL: Collagen, EPI: Epinephrine.
Official websites use .gov
A
.gov website belongs to an official
government organization in the United States.
Secure .gov websites use HTTPS
A lock (
) or https:// means you've safely
connected to the .gov website. Share sensitive
information only on official, secure websites.
Induced platelet aggregation ratios in Groups P and N. Group P: Patients with mitral stenosis, Group N: Control subjects, PPP: Platelet-poor plasma, Plt: platelet, ADP: Adenosine diphosphate, COL: Collagen, EPI: Epinephrine.