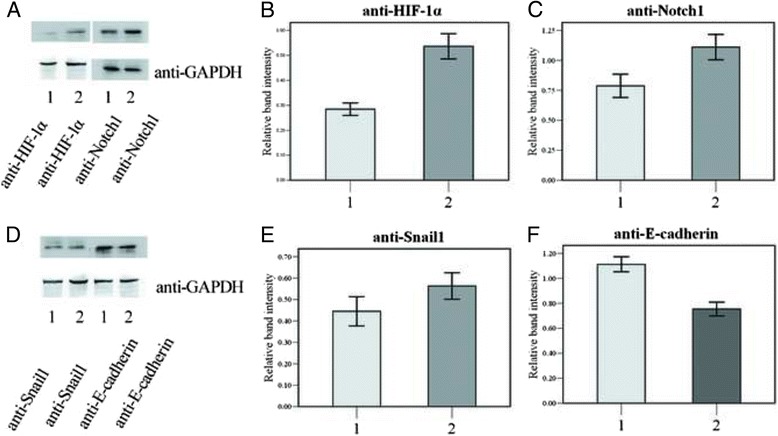
Fig. 3.

Protein expression of HIF-1α, Notch1, Snail and E-cadherin under the treatment with Cobalt chloride. Western blot images (a & d) and average relative band intensity of HIF-1α (b), Notch1 (c), Snail1(e) and E-cadherin (f) in SRA01/04 cells cultured in the presence (group2) or absence (group1) of 150μMCoCL2for 48 h
