
Table 2.
At upper lumbar levels (i.e. L1/2 and L2/3) the correlation showed either a quadratic (curvilinear) or a linear relationship
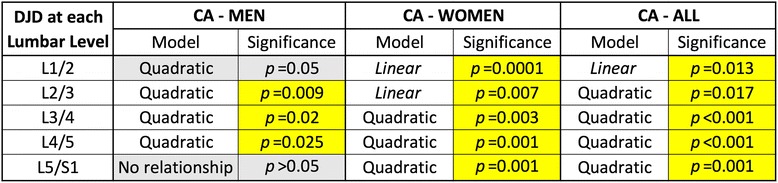
At lower levels however, the relationship was curvilinear, except at the L5/S1 level in men where no relationship was found. Again, correlations were stronger in women, in whom significantly lower p values were found at all lumbar levels