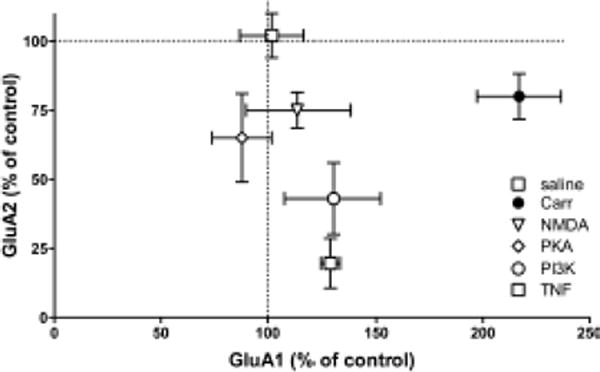
Figure 8.

Summary of plasma membrane levels of GluA1 and GluA2 after treatment. Rats were treated with saline, carrageenan, or carrageenan and i.t. inhibitors of NMDAR, PKA, PI3K, or TNF. Mean ± SEM from each treatment group is graphed as a percentage of saline/vehicle controls indicated as the origin on graph.
