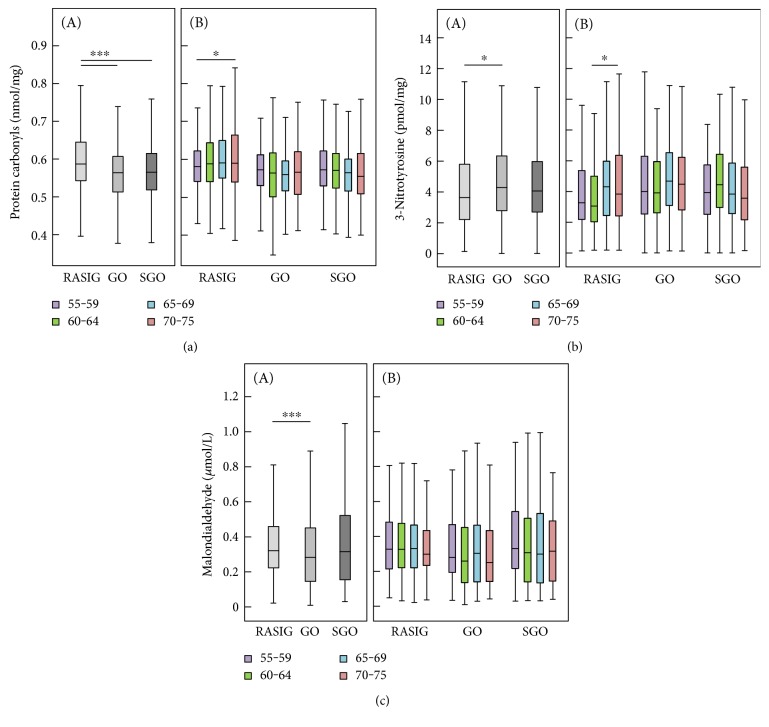
Figure 1.
Classical biomarkers of oxidative stress: protein carbonyls (a), 3-nitrotyrosine (b), and malondialdehyde (c). Biomarker concentrations are displayed according to study groups (A) and age groups (B), respectively. RASIG (n = 794); GO (n = 493); SGO (n = 272). Outliers and extreme values are included in the analyses but not shown in the figure. Statistically significant differences are indicated by asterisks: ∗P < 0.05 and ∗∗∗P < 0.001.

