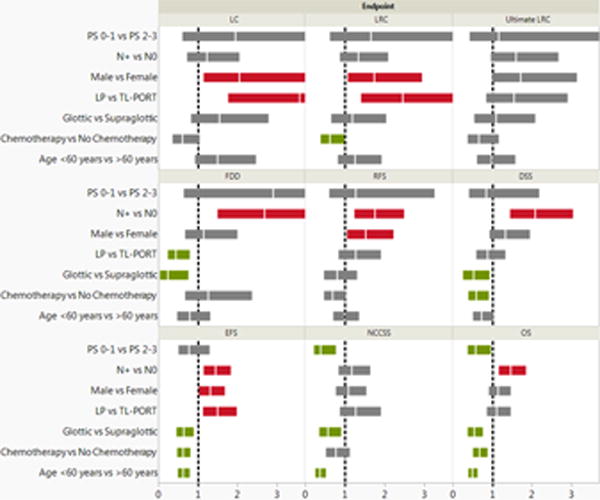
Figure 2.

Results of a multivariate analysis for all survival endpoints. The vertical white lines on the colored boxplots represent hazard ratios (HRs); the colored boxplots themselves represent 95% confidence intervals (CIs). Statistical significance is indicated if a boxplot does not encroach upon a risk ratio of 1.0 (indicated by vertical dashed lines); red boxplots represent increased risk of endpoint occurrence, green boxplots indicate increased reduced risk and grey boxplots indicate no statistically significant difference. Abbreviations: Local control (LC), locoregional control (LRC), ultimate LRC, freedom from distant disease (FDD), relapse-free survival (RFS), disease-specific survival (DSS), cancer event–free survival (EFS), non–cancer cause–specific survival (NCCSS), and overall survival (OS).
