
Figure 2. Larval behavioral, heartbeat and mitochondrial function in F0 and epigenetic generations F2.
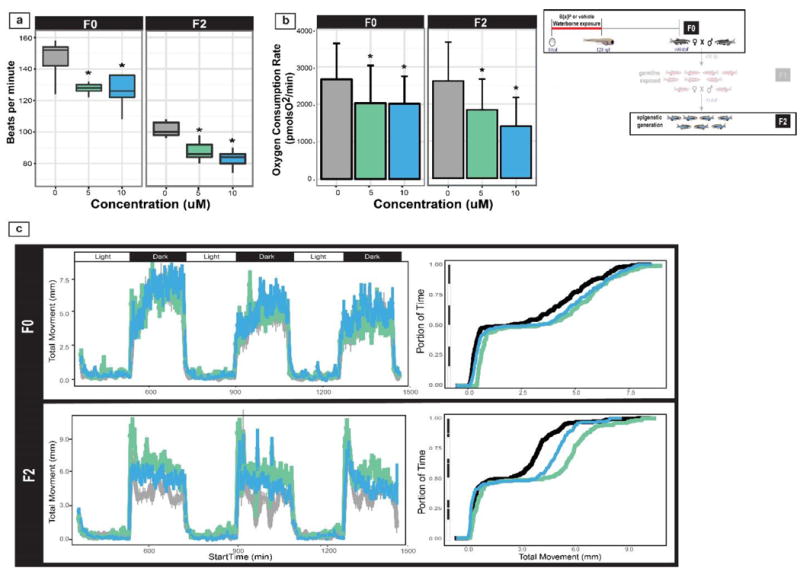
The inset (top right) illustrates the generation(s) discussed. (a) Heartrate differences for the F0 and F2 5 and 10 μM B[a]P and controls groups larvae. Note that while the relative treatments effects are conserved across generations, baseline heartrates differ because F2 animals were assayed 3°C cooler than the F0 animals (see Methods for details) (b) The oxygen consumption rate was measured in 24 hpf larvae in F0, and F2. * denotes statistical significance based on a one-way ANOVA (p < 0.05). (c) 5 day LPR response in the F2 larvae assessed in the light-dark assay.