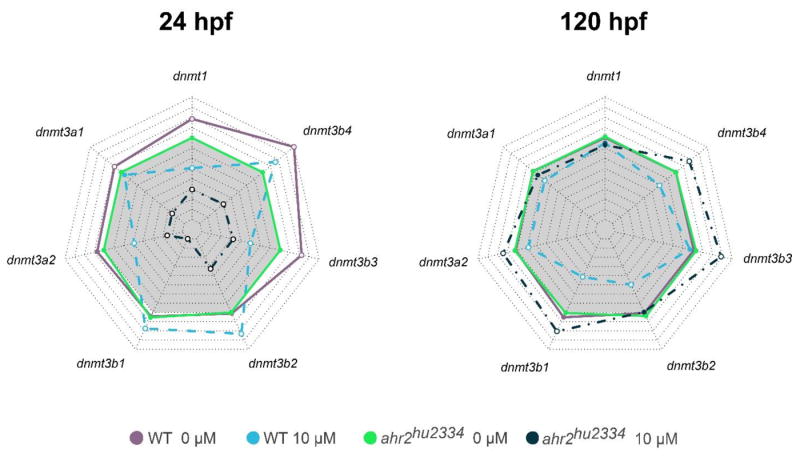
Figure 4. Dnmt expression in wild type (WT) and ahr2hu2334 embryos exposed to 0 and 10 μM B[a]P.

Gene expression changes were evaluated in WT and ahr2-null embryos at 24 (left panel) and 120 hpf (right panel). Beta-actin was used as an internal standard, and all values represent fold change relative to the controls. Two-way ANOVA with a Tukey Post Hoc was used to determine statistical significance. Points filled with white represent statistical significance (p<0.05). The gray shaded polygon represents 1-fold change. Any points within the gray represent repression of the gene.
