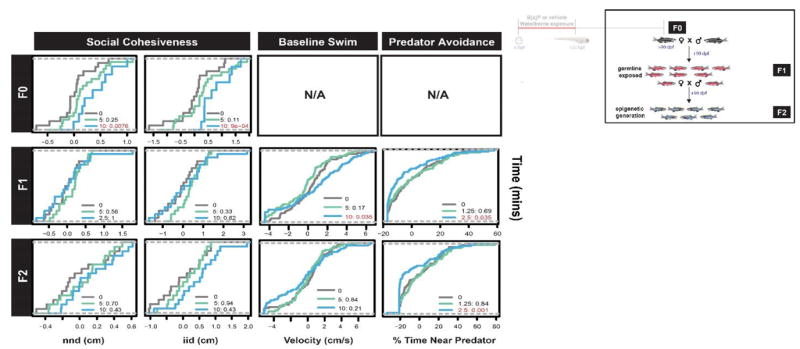
Figure 6. Persistent neurobehavioral deficits in F0, F1 and F2 cohort.

The inset (top right) illustrates the generation(s) discussed. F0 were evaluated in 1 neurobehavioral assay with 2 endpoints (nnd and iid) using 24 males and 24 females per treatment group. The N/A values denote assays that were not available at the time the F0 generation was tested. The cumulative distribution function (cdf) is illustrated for each lineage, with red text denoting statistically significant differences from the referent group (see Methods). The assays measured nearest neighbor distance (nnd), inter-individual distance (iid), the swimming velocity, and the preference for avoidance (% Time Near Predator). The gray line in each panel represents the vehicle lineage, with colored treatment lines indicating increases (right shift) or decreases (left shift) along the cumulative distribution for each assay.
